This article will introduce how I use the browser’s DevTools to understand React’s internal implementation.
When reading the source code of React, one problem we must encounter is that there are so many shared variables that indicate the internal states of React we haven’t learned yet.
By using the debugger statement, we can inspect the value of these variables and understand what’s happening inside the React at runtime. This also helps us focus on the main logic instead of getting distracted by other branches of conditions, including edge cases.
This approach is inspired by the “React Internals Deep Dive” series by JSer.
For anyone interested in the React source code, I highly recommend JSer’s posts and videos. They provide an excellent walkthrough of how commonly used React functions work internally.
Set Up the Environment
React’s official contribution guide provides a tutorial on how to build React from source code:
The easiest way to try your changes is to run
yarn build react/index,react-dom/index --type=UMDand then openfixtures/packaging/babel-standalone/dev.html. This file already usesreact.development.jsfrom the build folder so it will pick up your changes.
This gives us a good starting point to debug React’s internal implementation. Here’s the content of dev.html (v18.3.1):
We can see that it uses babel-standalone to transpile the JSX code. Therefore, we can write JSX inside the <script type="text/babel"> tag.
The instruction in the official contribution guide use --type=UMD which will create both development and production builds. According to the build script, we can specify the type with UMD_DEV or UMD_PROD to get the development or production build only.
The default dev.html uses the development build of React. The development build is not minified and contains the source code of React, making it easier to read. But with the development build, the __DEV__ flag is set to true, which will lead to executions of many logic branches just for development purposes. These are noises for us when we want to use debugging tools to understand React’s internal logic.
On the other hand, the production build is more fit to our purpose to observe the actual behavior of React in a real-world application.
So, we can turn off the minification and dead code elimination when creating the production build by modifying the build script:
This function is used to prepare the plugins for Rollup
// ...return [// ...// Apply dead code elimination and/or minification.isProduction &&closure(Object.assign({}, closureOptions, {// Don't let it create global variables in the browser.// https://github.com/facebook/react/issues/10909assume_function_wrapper: !isUMDBundle,renaming: !shouldStayReadable,}),),// ...].filter(Boolean);}
After commenting out or deleting the lines that turn on the minification and dead code elimination, we can run yarn build react/index,react-dom/index --type=UMD_PROD to create the readable production build of React and ReactDOM.
Remember to update the script tags in the dev.html with the newly built files in the build folder:
We only removed the plugin but did not change the name of the output.
So, the name of the output files still have "min" in their names.
</body></html>
Add React Components and Debugger
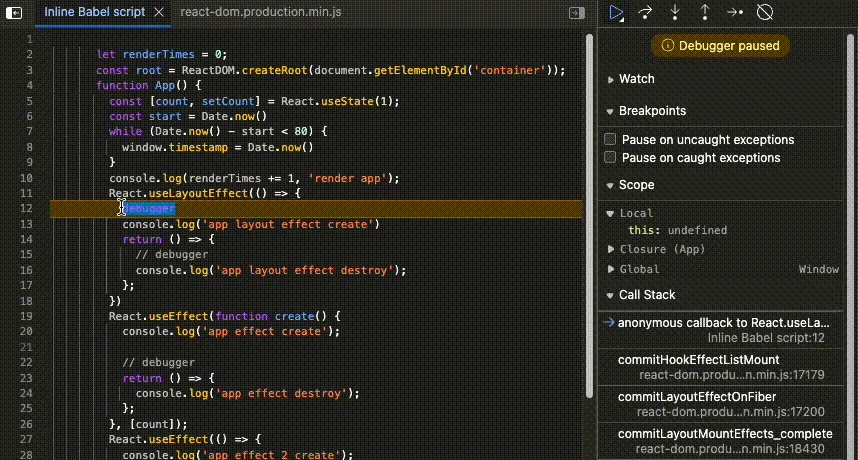
Now, the environment is ready. We can write the code that we want to observe and add breakpoints to inspect the execution flow of it via the browser’s DevTools:
Starting from the breakpoint set in the App function, we can use the “Step” button in the Browser’s DevTools to step into React’s internal implementation: